


Software architecture is not merely about writing code; it is about communicating complex systems to humans. When building modern applications, we rarely operate in isolation. We rely on external services, cloud platforms, and specialized third-party APIs to deliver value. However, representing these external dependencies accurately in our architecture diagrams is a common challenge. This guide focuses on the C4 model, specifically Level 2 (Container Diagrams), and how to document third-party API integrations with precision and clarity.
📐 The Context of C4 and Container Diagrams
The C4 model provides a structured approach to software architecture documentation. It consists of four levels: System Context, Container, Component, and Code. While the System Context level shows how a system fits into the wider world, the Container Diagram digs deeper. It displays the high-level technical building blocks of a single system.
When a third-party API is involved, it often blurs the line between an internal component and an external dependency. In a Container Diagram, these external services should be treated as distinct containers. This distinction is vital for understanding trust boundaries, data flow, and maintenance responsibilities.
🌐 Defining the Boundary of Third-Party Integrations
Visualizing the boundary between your system and an external service is the first step. Misrepresenting this boundary can lead to confusion during onboarding or troubleshooting.
- Trust Boundaries: Clearly delineate where your control ends and the external provider’s begins. This is crucial for security audits.
- Dependency Management: Understand that if the external API changes, your system might break. The diagram should reflect this coupling.
- Ownership: Who is responsible for uptime? Who manages the API keys? The diagram serves as a reference for operational responsibility.
Do not hide third-party services inside your own container shapes. Instead, place them outside your system boundary but close enough to show the relationship. This visual separation reinforces the concept that you do not own the infrastructure of the external service.
🎨 Visual Standards and Iconography
Consistency is key in technical documentation. When representing external APIs, use standard shapes or icons that indicate an external nature. Avoid using the same icon for your internal microservice and the external SaaS platform.
- External Containers: Use a distinct shape or border style to signify an external system.
- Iconography: If your tool allows, use a generic “cloud” or “server” icon for cloud-based APIs, and a “database” icon for external data stores.
- Labels: Always label the container with the specific service name (e.g., “Payment Gateway”) rather than a generic term.
Example Visual Representation
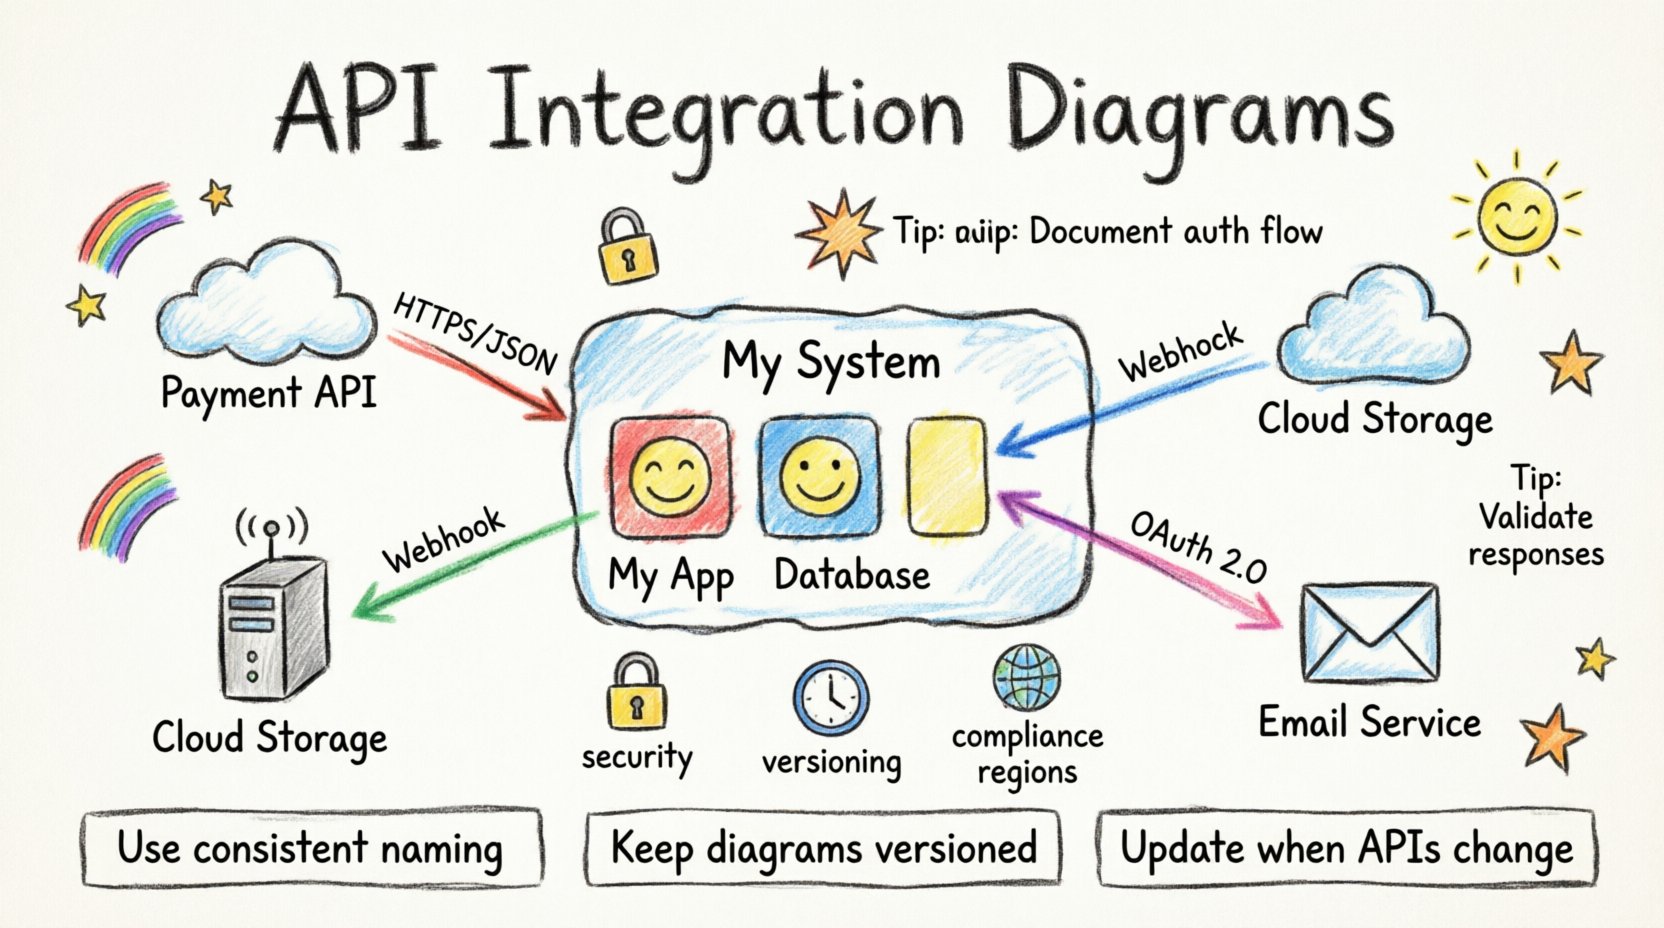
Consider a scenario where your application integrates with a cloud storage provider. Your internal container might look like a standard box. The external storage service should look like a cloud shape or a box with a dashed border to indicate it is outside your direct control.
🔗 Relationship Lines and Data Flow
Arrows in a container diagram are not just connectors; they are descriptions of data movement and dependency. When drawing lines to third-party APIs, the direction and label matter significantly.
- Directionality: Does your system push data to the API, or does it pull data? Use arrows to indicate the primary flow.
- Protocol Labels: Label the relationship line with the protocol used (e.g., REST, GraphQL, SOAP, Webhooks).
- Frequency: If the integration is real-time versus batch processing, this can be noted on the relationship line or in a legend.
For example, a line labeled “HTTPS / JSON” indicates a standard web request. A line labeled “Webhook / Event” indicates an asynchronous push from the external system to yours.
🛡️ Security and Authentication in Diagrams
Security is a critical aspect of architecture documentation. You do not need to show every single bit of code, but you must indicate how security is handled at the integration point.
Authentication Methods
Indicate the authentication mechanism used for the API. This helps security teams assess risk quickly.
- API Keys: Simple but requires secure storage.
- OAuth 2.0: More complex, involves user consent and token management.
- Basic Auth: Often discouraged for public APIs but common in internal legacy integrations.
- mTLS: Mutual TLS for high-security environments.
You can add a note or a small icon near the relationship line to indicate the security method. This avoids cluttering the diagram while retaining vital information.
Data Sensitivity
What data is being transmitted? If your system sends PII (Personally Identifiable Information) to a third party, this must be documented. Use color coding or specific annotations to highlight sensitive data flows. This ensures that compliance officers can quickly identify areas requiring encryption or specific legal agreements.
🔄 Maintenance and Versioning
APIs change. They get deprecated, updated, or shut down. Your documentation must support the lifecycle of these integrations.
- Version Control: Include the API version in the container label (e.g., “Payment API v2”).
- Deprecation Status: If an API is scheduled for removal, mark it clearly.
- Support Contact: Ideally, link the diagram to a document that lists the vendor support channels.
Without version information, developers may attempt to use an endpoint that no longer exists. This leads to downtime and frustration. The diagram should be treated as living documentation, updated whenever the integration changes.
📊 Common Integration Patterns
There are several common ways systems interact with external APIs. Understanding these patterns helps in creating accurate diagrams.
| Pattern | Description | Diagram Note |
|---|---|---|
| Synchronous Request | Your system waits for a response before continuing. | Label as “HTTP Request” with timeout details. |
| Asynchronous Webhook | External system pushes data to your system. | Label arrow direction: External → Internal. |
| Batch Processing | Data is transferred in large chunks on a schedule. | Note “Scheduled Job” or “Cron” near the link. |
| Embedded SDK | Code from the provider runs inside your process. | Draw as an internal component within your container. |
Using a table like this within your documentation can help standardize how these patterns are represented across different diagrams in your organization.
⚠️ Common Pitfalls to Avoid
Even experienced architects make mistakes when documenting integrations. Being aware of these pitfalls helps you maintain high-quality diagrams.
- Over-Abstraction: Do not group all external services into a single “Cloud” box. Each API has a different risk profile and SLA.
- Missing Latency: If your system depends on a slow API, note this. It impacts user experience and design decisions.
- Ignoring Failures: What happens if the API is down? Your diagram should ideally support a “Failure Mode” appendix.
- Outdated Labels: Ensure the labels match the current implementation. An outdated diagram is worse than no diagram at all.
🔍 Technical Implementation Details
While diagrams are high-level, they should point to technical details. You do not need to show code, but you should link to the specification.
- OpenAPI Specification: Link to the Swagger or OpenAPI document for REST APIs.
- Webhook Documentation: Provide a link to the event schema for webhook integrations.
- Rate Limits: If there are strict rate limits, mention them in the container description.
This approach bridges the gap between the visual architecture and the engineering reality. It allows developers to find the necessary technical specs without searching through multiple repositories.
📝 Updating the Documentation
Documentation decays. To keep third-party API documentation relevant, integrate it into your development workflow.
- PR Requirements: Require that architecture diagrams are updated as part of a Pull Request that changes an integration.
- Owner Assignment: Assign an architect or lead developer as the owner of the diagram.
- Review Cycles: Schedule a quarterly review of all container diagrams to ensure they match the deployed code.
By treating the diagram as code, you ensure its accuracy over time. This is essential for long-term maintainability of the system.
🧩 Handling Complex Multi-Step Integrations
Sometimes, an integration is not a simple request. It involves a sequence of steps, such as a checkout flow involving a payment gateway, a fraud check service, and an email notification system.
- Flow Diagrams: Use a sequence diagram for complex flows, but keep the container diagram focused on the connections.
- Composite Containers: If multiple external services work together as a single logical unit, group them visually but label them as a composite dependency.
- State Management: Note where the state is held. Is it in your database or the external service?
This clarity prevents developers from assuming the wrong behavior during implementation. For instance, knowing that the external service holds the transaction state means your system must handle retries carefully.
🌍 Global and Compliance Considerations
Third-party services often operate in specific regions. This has implications for data residency and compliance.
- Region Tagging: Label the container with the data center region (e.g., “US-East”, “EU-West”).
- GDPR/CCPA: If data leaves a specific jurisdiction, mark the container with a compliance flag.
- Latency Impact: Regional distance affects latency. Document this if it impacts SLAs.
These details are often missed but are critical for legal and operational teams. A simple tag on the container can trigger necessary compliance checks before deployment.
🚀 Scaling and Performance Implications
As your system grows, third-party integrations can become bottlenecks. Your diagram should hint at these constraints.
- Throughput: Does the API support the volume of requests you expect?
- Caching: If you cache responses from the API, show the cache layer in the diagram.
- Queueing: If you queue requests to avoid rate limits, represent the queue as an internal component.
By visualizing these constraints, you make the architecture decisions transparent. It helps stakeholders understand why certain patterns (like caching or queuing) were chosen.
📚 Conclusion on Documentation Standards
Documenting third-party API integrations in container diagrams is more than a drawing exercise. It is a communication tool that defines boundaries, responsibilities, and risks. By following these guidelines, you create diagrams that are accurate, maintainable, and useful for the entire team. Consistency in representation, clear labeling of security and data flow, and regular updates ensure that your architecture documentation remains a reliable source of truth. As systems evolve, so must your diagrams. Treat them with the same care as your source code, and they will serve your organization well.