


In the landscape of modern software development, a significant disconnect often exists between the technical team and business leadership. Executives care about value, risk, and time-to-market. Developers care about performance, scalability, and maintainability. Bridging this gap is critical for project success. The C4 Model offers a structured approach to visualizing software architecture at different levels of detail. By adopting this model, teams can translate technical intricacies into clear business narratives.
When stakeholders cannot visualize how a system works, they struggle to make informed decisions. Ambiguity leads to fear, and fear leads to micromanagement. A clear architectural view empowers everyone to understand the implications of change. This guide details how to leverage the C4 Model to communicate effectively, ensuring alignment across the organization without drowning non-technical readers in code.
The Communication Gap in Software Development 🗣️
Software architecture is inherently complex. Systems consist of interconnected services, databases, APIs, and user interfaces. When this complexity is hidden behind layers of abstraction, it becomes difficult for non-engineers to grasp.
- Executive Leadership: They need to know the strategic value. How does this system support revenue? What are the risks?
- Product Owners: They need to understand feature delivery. How does this change affect the roadmap?
- Operations Teams: They need to know stability. How do we monitor and deploy this?
- Developers: They need to know implementation. How do I write the code?
Traditional documentation often fails to address these specific needs. It tends to be either too high-level to be useful or too low-level to be readable. The C4 Model solves this by providing a hierarchy of abstraction.
Understanding the C4 Model 🧩
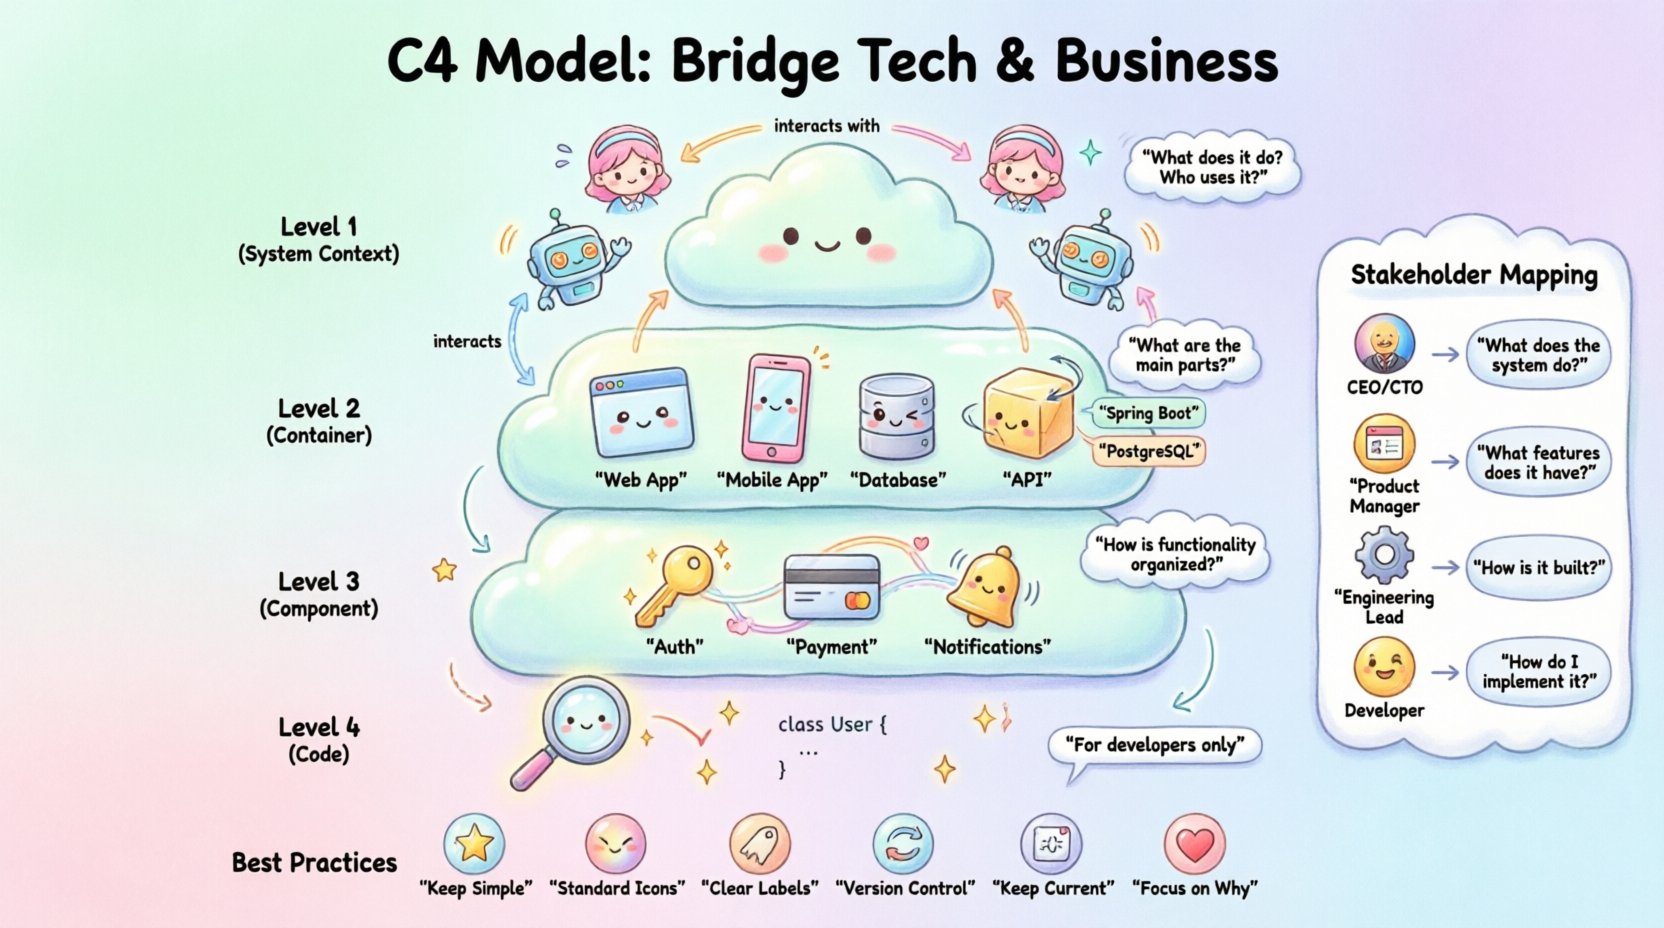
The C4 Model is a framework for creating software architecture diagrams. It was designed to be simple, scalable, and easy to understand. It focuses on four distinct levels of detail. Each level answers a specific question about the system.
The core philosophy is to not draw everything at once. Instead, you create a set of diagrams that tell a story from the outside in. This prevents the “spaghetti diagram” syndrome where everything is visible but nothing is clear.
Level 1: System Context Diagram 🌍
The System Context diagram is the highest level of abstraction. It represents the software system as a single box in the center. Around this box, you place the people and systems that interact with it.
What it Shows
- The System: The software product or service being built.
- Users: The human actors who interact with the system.
- External Systems: Other applications or services the system talks to.
- Relationships: Lines showing data flow or interaction between entities.
Why it Matters for Stakeholders
This diagram is the primary tool for business communication. It answers the question: “What does this system do, and who uses it?”
- Clarity: It removes technical noise. No servers, no code, no protocols.
- Scope: It clearly defines the boundaries of the project.
- Dependencies: It highlights reliance on third-party services.
When presenting this to executives, focus on the business value. Explain that the system processes orders, manages customer data, or generates reports. Do not discuss internal logic here.
Level 2: Container Diagram 📦
Once the context is established, the next step is to look inside the system box. The Container diagram breaks the system down into high-level building blocks. A container is a deployable unit of software, such as a web application, a mobile app, a database, or a microservice.
What it Shows
- Containers: Distinct units like a Web Application, a Mobile App, or a Serverless Function.
- Technologies: The type of technology used, such as “Java Spring Boot” or “PostgreSQL”.
- Communication: How containers talk to each other (e.g., HTTP, RPC).
- Users: How the external actors connect to these specific containers.
Why it Matters for Stakeholders
This diagram helps product owners and architects understand the technical landscape without getting bogged down in code. It answers the question: “What are the main parts of the system?”
- Cost Estimation: Different containers may have different hosting costs.
- Team Structure: Different teams often own different containers.
- Risk Assessment: Some containers may be more volatile than others.
For example, if a stakeholder asks, “Why do we need a database service?”, this diagram shows the dedicated container for data storage. It justifies the resource allocation.
Level 3: Component Diagram ⚙️
Inside a container, there are components. These are logical groupings of functionality. A component is a unit of software that performs a specific task, such as an Authentication Service, a Payment Processor, or a Notification Engine.
What it Shows
- Components: Logical units of functionality within a container.
- Interfaces: How components expose their functionality to other components.
- Connections: The flow of data between internal parts.
Why it Matters for Stakeholders
This level is typically for technical stakeholders, but it can be valuable for product owners planning complex features. It answers the question: “How is this functionality organized?”
- Feature Mapping: It helps map business features to technical components.
- Refactoring: It shows where code changes might impact other areas.
- Ownership: It clarifies which team owns which piece of logic.
When discussing a new feature request, this diagram helps identify which component needs modification. It prevents the assumption that “everything is connected to everything”.
Level 4: Code Diagram 🔍
The final level is the code diagram. It shows the structure of the code within a component. This includes classes, interfaces, and methods. This level is rarely necessary for non-technical stakeholders.
When to Use It
- Onboarding New Developers: Helps them understand the codebase quickly.
- Code Reviews: Provides context for specific implementation details.
- Debugging: Helps trace specific logic paths during incidents.
Stakeholder Relevance
For executives and product managers, this level is usually too detailed. It introduces too much cognitive load. However, it is part of the model for completeness. If a stakeholder asks about a specific bug, a code diagram might help the engineering team explain the root cause, but the summary should remain at the component level.
Mapping Audiences to Diagram Levels 👥
Not every stakeholder needs to see every diagram. Effective communication requires tailoring the message to the audience. The following table outlines which diagrams are appropriate for different roles.
| Stakeholder Role | Primary Focus | Recommended Diagram Level | Key Question to Answer |
|---|---|---|---|
| CEO / CTO | Strategy & Risk | Level 1: Context | “How does this support our business goals?” |
| Product Manager | Features & Roadmap | Level 1 & 2: Context & Containers | “Where does this feature fit in the system?” |
| Engineering Lead | Implementation & Tech Debt | Level 2 & 3: Containers & Components | “How do we build and maintain this?” |
| Developers | Code & Logic | Level 3 & 4: Components & Code | “How do I write the code?” |
Using this matrix ensures you do not overwhelm a CEO with code diagrams, nor do you confuse developers with high-level context maps. It creates a shared language for the organization.
Best Practices for Architecture Documentation 📝
Creating diagrams is only half the battle. Maintaining them and integrating them into the workflow is where the real value lies. Here are key practices to ensure your documentation remains useful.
- Keep it Simple: Avoid unnecessary detail. If a stakeholder cannot understand it in five minutes, simplify it further.
- Use Standard Icons: Use common shapes for people, boxes for systems, and cylinders for databases. Consistency reduces confusion.
- Label Clearly: Every line should have a label explaining the data flow. Don’t leave connections unlabeled.
- Version Control: Treat diagrams as code. Store them in version control so changes are tracked over time.
- Keep it Current: Outdated diagrams are worse than no diagrams. Update them whenever significant changes are made.
- Focus on the “Why”: Don’t just show the “What”. Explain why certain decisions were made regarding technology or structure.
Documentation should be a living artifact. It evolves as the system evolves. If the system changes but the diagram does not, the diagram is no longer a source of truth.
Avoiding Common Pitfalls ⚠️
Even with a good model, teams can stumble. Common mistakes can undermine the effectiveness of the C4 Model.
1. Over-Documenting
Creating diagrams for every single feature leads to documentation bloat. This discourages maintenance. Focus on the stable parts of the architecture. Document the skeleton, not the flesh.
2. Ignoring the Audience
Sharing a Level 3 Component diagram with a marketing team will likely confuse them. They need the business context, not the internal logic. Tailor the output.
3. Focusing on Technology Too Early
Don’t get caught up in choosing the database or framework before understanding the problem. The C4 Model allows you to focus on structure before technology. Keep technology labels generic until necessary.
4. Creating Diagrams in Isolation
One person drawing diagrams without input from the team leads to inaccuracies. Architecture is a team effort. Review diagrams with developers to ensure they reflect reality.
5. Static Documentation
Putting diagrams in a PDF that never changes is a waste of time. Use tools that allow for easy updates or link diagrams to the codebase where possible.
Fostering a Collaborative Culture 🤝
The ultimate goal of the C4 Model is not just to draw pictures. It is to foster a culture of clarity and collaboration. When everyone understands the architecture, they can contribute better ideas.
- Onboarding: New hires can learn the system structure in days rather than weeks.
- Decision Making: Teams can evaluate technical decisions based on a shared visual understanding.
- Risk Management: Bottlenecks and single points of failure become visible early.
- Knowledge Sharing: Documentation reduces dependency on specific individuals.
By investing time in clear communication, you reduce the cognitive load on your team. This allows engineers to focus on solving problems rather than explaining them.
Final Thoughts on Architecture Communication
Software systems are complex by nature. However, the complexity of the system should not translate to the complexity of the communication. The C4 Model provides a proven framework to simplify this process. It respects the needs of different audiences by offering the right level of detail at the right time.
Start small. Begin with the System Context diagram. Get your stakeholders to agree on the boundaries. Then, drill down into containers as the need arises. Do not try to document everything at once. Focus on the story your system tells.
When you communicate effectively, you build trust. When you build trust, you build better products. Use these diagrams not as a requirement for bureaucracy, but as a bridge to understanding. By aligning technical reality with business vision, you ensure that software serves its intended purpose.
Remember, the best architecture is the one that is understood by the people who build it and the people who buy it. The C4 Model is a tool to achieve that understanding. Use it wisely, keep it updated, and share it widely.