


Enterprise Architecture is the backbone of organizational strategy. It defines how business capabilities align with technology capabilities and data flows. However, a static model is insufficient. The modern enterprise is dynamic, and the architecture must evolve alongside it. To navigate this complexity, organizations require a method to assess the structural integrity of their architectural models. This is where evaluating architecture health becomes critical. By utilizing ArchiMate metrics, stakeholders gain visibility into the stability, agility, and maintainability of their IT landscape.
Without measurement, architectural decisions become based on intuition rather than evidence. This guide provides a comprehensive framework for understanding how to assess architectural quality. We will explore specific metrics derived from the ArchiMate modeling standard, discuss implementation strategies, and highlight common pitfalls to avoid. The goal is to establish a robust governance cycle that ensures your architecture remains a reliable asset.
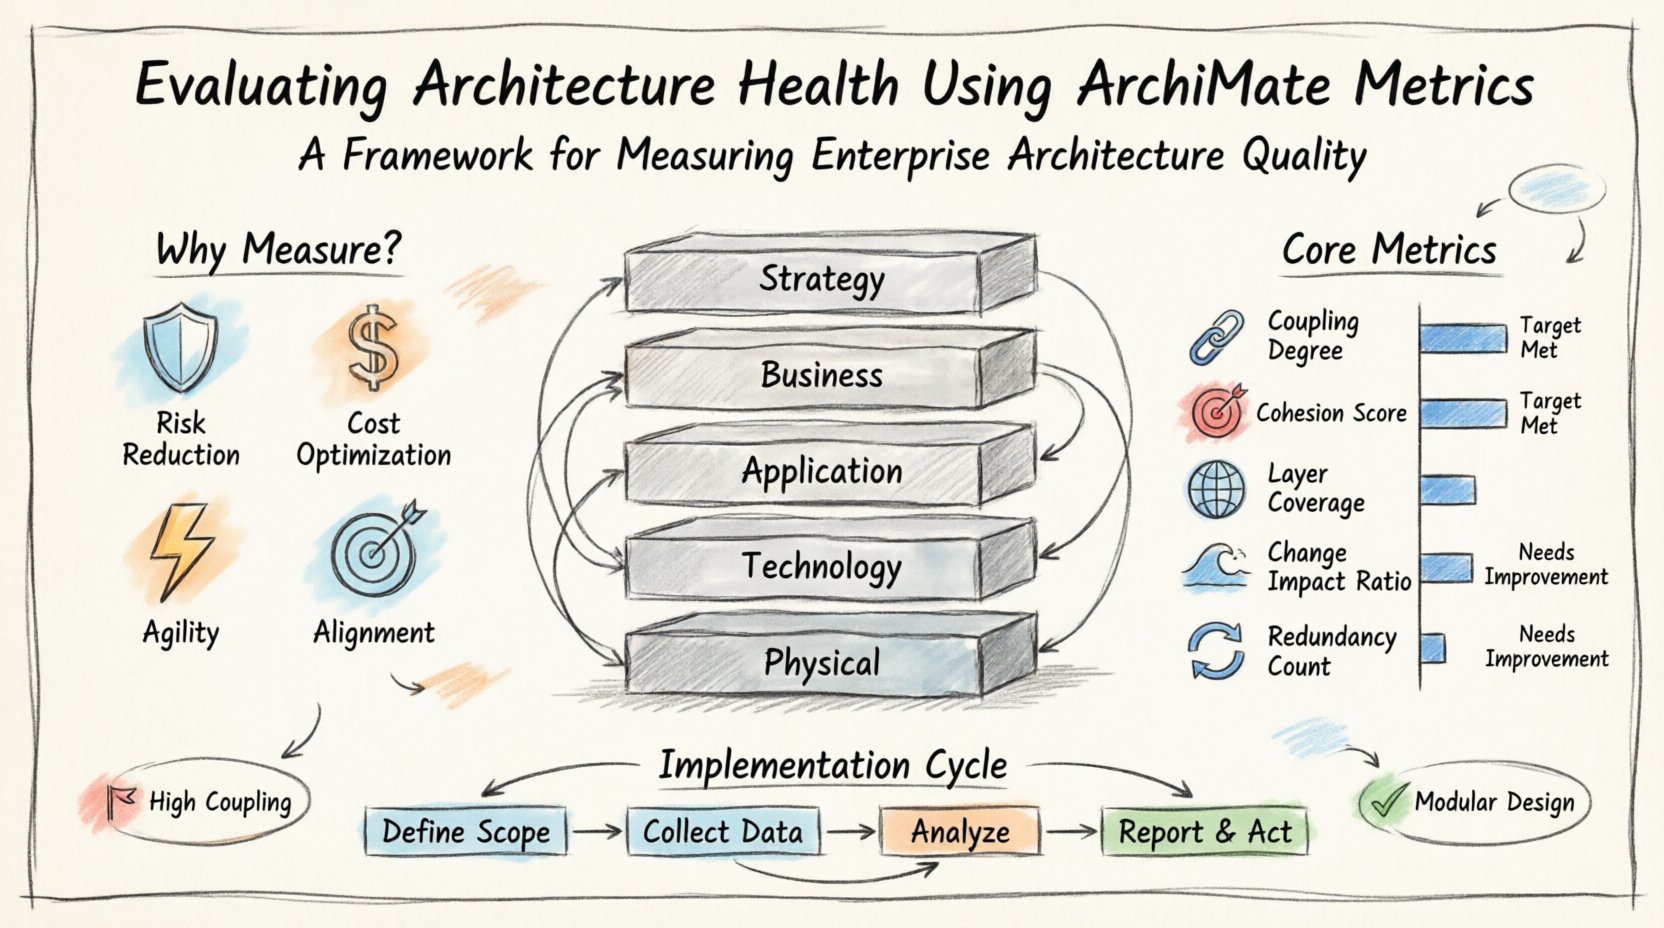
Why Measure Architecture Health? 🤔
Many organizations treat architecture documentation as a compliance exercise. They create diagrams to satisfy audit requirements, but these models quickly become outdated. Measuring architecture health shifts the focus from documentation to value. It transforms the model from a static picture into a living instrument of analysis.
There are several key drivers for implementing architecture metrics:
- Risk Reduction: Identifying fragile dependencies prevents system failures during updates. If a specific technology component has too many connections, changing it could cascade through the entire ecosystem.
- Cost Optimization: Metrics reveal redundancy. You might find multiple applications serving the same business function, leading to unnecessary licensing and maintenance costs.
- Agility Assessment: A healthy architecture supports change. High coupling makes it difficult to modify parts of the system without breaking others. Metrics quantify this resistance to change.
- Alignment Verification: Ensuring that technology investments actually support business goals. If the business strategy shifts, the architecture should reflect that shift quickly.
By quantifying these aspects, leadership can make informed decisions about where to invest resources. This moves the conversation from abstract concepts to tangible data points.
Understanding ArchiMate Layers and Relationships 🧱
To measure health effectively, one must understand the structure of the ArchiMate standard. ArchiMate divides enterprise architecture into several layers and domains. Each layer represents a different viewpoint on the organization.
The standard layers include:
- Strategy: Defines the business requirements, principles, and goals. This is the foundation of the model.
- Business: Describes the business processes, roles, and interactions. This layer connects strategy to execution.
- Application: Details the software applications and services that automate business processes.
- Technology: Covers the hardware, networks, and infrastructure that host the applications.
- Physical: Represents the actual hardware nodes and locations.
Health is not just about the elements within these layers, but also the relationships between them. ArchiMate defines specific relationship types such as Assignment, Aggregation, Composition, Realization, and Access. The health of the model depends heavily on how these relationships are utilized.
For instance, excessive Access relationships between applications and business processes might indicate a need for better abstraction. Conversely, a lack of Assignment relationships between roles and processes might suggest unclear responsibilities. Understanding these mechanics is the first step in defining meaningful metrics.
Core Metrics for Architecture Assessment 📏
Not all metrics are created equal. Some are vanity metrics that look good on a dashboard but offer no insight into system stability. To get real value, focus on metrics that correlate with maintenance effort, risk, and flexibility. The following table outlines the essential metrics for evaluating architecture health.
| Metric Name | Definition | What It Indicates | Target State |
|---|---|---|---|
| Coupling Degree | Number of dependencies a component has on others. | System complexity and change risk. | Low (Modular) |
| Cohesion Score | How closely related the elements within a component are. | Responsibility clarity and focus. | High (Focused) |
| Layer Coverage | Percentage of business functions mapped to applications. | Business-IT alignment completeness. | High (100%) |
| Change Impact Ratio | Number of downstream elements affected by a change. | Stability and maintainability. | Low (Predictable) |
| Redundancy Count | Number of duplicate capabilities or services. | Cost efficiency and waste. | Low (Minimal) |
Let us examine these metrics in greater detail to understand how they are calculated and interpreted.
1. Coupling Degree 🔗
Coupling refers to the degree of interdependence between software modules or architectural components. In ArchiMate terms, this often involves relationships like Access, Assignment, or Flow. High coupling means that to change one element, you must change or understand many others.
Why it matters:
- Maintainability: High coupling increases the time required to fix bugs or add features.
- Stability: Systems with high coupling are prone to cascading failures.
- Scalability: It is difficult to scale a tightly coupled system without significant refactoring.
How to measure: Count the outgoing and incoming relationships for specific application services or components. An application with 50 incoming dependencies is riskier than one with 5. Trending this number over time helps identify if the architecture is becoming more complex or simpler.
2. Cohesion Score 🎯
Cohesion measures how strongly related and focused the responsibilities of a single module are. In the context of ArchiMate, this can be seen in how well a business process is mapped to a specific application service. High cohesion means a component does one thing well.
Why it matters:
- Understandability: Teams can understand a component’s purpose quickly.
- Reusability: Highly cohesive components can be reused in different contexts without side effects.
- Isolation: Issues are contained within the component rather than spreading.
How to measure: Analyze the relationships between a business process and the supporting applications. If a single business process relies on 10 different applications, cohesion is low. If it relies on a single, well-defined service, cohesion is high.
3. Layer Coverage 🌐
Coverage ensures that the business strategy is fully supported by the underlying technology. If a business process exists in the model but has no application support, it may be manual or non-existent. If an application exists but has no business process support, it might be legacy waste.
Why it matters:
- Strategic Alignment: Confirms technology investments match business needs.
- Gap Analysis: Highlights areas where the business is unsupported or over-engineered.
- Modernization: Identifies legacy systems that no longer serve a business purpose.
How to measure: Calculate the ratio of business processes to application services. A ratio of 1:1 is ideal for mapping, though some many-to-one relationships are acceptable for shared services.
4. Change Impact Ratio ⚡
This metric estimates the effort required to make a change. It is calculated by tracing the dependencies from a source element (e.g., a server) to all downstream elements (e.g., applications, business services).
Why it matters:
- Risk Management: Helps assess the risk of planned maintenance windows.
- Cost Estimation: Provides a basis for calculating the cost of architectural changes.
- Decision Support: Helps choose between alternatives with different impact profiles.
5. Redundancy Count 🔄
Redundancy occurs when multiple components perform the same function. While some redundancy is good for high availability, unnecessary redundancy drives up cost and complexity.
Why it matters:
- Cost Control: Reduces licensing and infrastructure spend.
- Complexity: Reduces the number of systems to manage and secure.
- Consistency: Ensures data and processes are consistent across the enterprise.
Implementing the Measurement Process 🛠️
Defining metrics is one thing; implementing them is another. You cannot simply install a tool and expect data to appear. The process requires discipline and a clear governance framework. Follow these steps to establish a measurement routine.
Step 1: Define Scope and Standards
Before measuring, establish what constitutes a valid model. Define naming conventions, relationship rules, and layer definitions. Without standardization, metrics will be inconsistent. For example, decide how you define a Business Process. Is it a high-level function or a specific task? This definition must be consistent across the organization.
Step 2: Data Collection and Validation
Gather the data from your architecture repository. This often involves exporting models or querying the database. Validation is crucial here. Ensure that the data is accurate. If the model is outdated, the metrics will be misleading. Implement a review cycle where architects sign off on the data before it is used for reporting.
Step 3: Analysis and Benchmarking
Once collected, analyze the data against your targets. Compare current metrics against historical data. Are coupling levels increasing? Is coverage improving? If you have multiple business units, benchmark them against each other. This helps identify best practices and areas needing improvement.
Step 4: Reporting and Action
Metrics are useless if they do not drive action. Create reports tailored to different audiences. C-level executives need high-level summaries of risk and alignment. Architects need detailed breakdowns of coupling and redundancy. Ensure that every metric is linked to an action item. If a metric is red, assign a task to address it.
Interpreting the Data: Red Flags vs Green Flags 🚩
Not all deviations from the target state are bad, but most require investigation. Understanding the context is key to interpreting the results correctly.
Common Red Flags
- High Coupling in Core Systems: If the core business application has high coupling, the risk of failure is significant.
- Zero Coverage: If a critical business capability has no application support, the organization may be relying on shadow IT or manual spreadsheets.
- Orphaned Elements: Elements that exist in the model but have no relationships are likely outdated and should be archived.
- Excessive Vertical Dependency: If the Technology layer is deeply coupled to the Business layer without the Application layer as an intermediary, the architecture lacks abstraction.
Common Green Flags
- Clear Abstraction Layers: Applications shield the business from technology changes.
- Modular Structure: Components are self-contained and interact through well-defined interfaces.
- Up-to-Date Models: The model reflects the current state of the enterprise accurately.
- Consistent Naming: Elements are named consistently, making the model readable and searchable.
Governance and Maintenance 👮♂️
Architecture health is not a one-time achievement. It is a continuous state that requires active maintenance. Governance is the framework that ensures the architecture remains healthy over time.
Key Governance Activities:
- Architecture Review Boards: Regular meetings to review proposed changes against the architecture standards. This prevents technical debt from accumulating.
- Model Versioning: Track changes to the model over time. This allows you to see how metrics evolve.
- Training: Ensure architects and stakeholders understand the ArchiMate standard. Misunderstanding the language leads to poor modeling practices.
- Audit Cycles: Periodically audit the repository to ensure data quality. Remove stale elements and update deprecated relationships.
By integrating these activities into the project lifecycle, architecture becomes a natural part of how the organization operates, rather than a separate administrative burden.
Common Pitfalls to Avoid ⚠️
Even with the best intentions, organizations often stumble when trying to measure architecture health. Being aware of these pitfalls can save time and effort.
- Over-Modeling: Creating too much detail can make the model unmanageable. Focus on the architecture that matters for decision-making. Ignore implementation details that do not affect strategic planning.
- Tool Dependency: Do not rely solely on the software to generate metrics. The tool provides the data, but human judgment is required to interpret the context.
- Ignoring the Business View: Focusing only on technology metrics misses the bigger picture. The architecture must serve the business first.
- Static Benchmarks: Benchmarks should evolve. What was acceptable coupling ten years ago might be unacceptable today due to the rise of microservices and cloud computing.
Final Thoughts on Architectural Maturity 🚀
Evaluating architecture health using ArchiMate metrics is a journey toward maturity. It moves the organization from reactive fire-fighting to proactive planning. By quantifying the structural integrity of your enterprise architecture, you empower stakeholders to make better decisions.
The path forward requires commitment. It demands that you treat the architecture model as a living asset that requires regular care. It requires collaboration between business and IT to ensure the metrics reflect reality. When done correctly, these metrics provide a clear signal of where the organization stands and where it needs to go.
Start small. Pick one or two metrics to focus on, such as Coupling Degree and Layer Coverage. Establish a baseline. Then, work to improve those numbers over time. As the culture of measurement takes root, you will find that the architecture becomes a strategic enabler rather than a constraint.
Remember, the goal is not perfection. The goal is visibility and control. With the right metrics in place, you gain the confidence to navigate the complexities of the digital landscape. This is the essence of a healthy, resilient enterprise architecture.