


💡 Key Takeaways
- Visualizing Time: Timing diagrams map signal transitions over time, offering precision that sequence diagrams lack.
- Constraint Definition: They define strict deadlines and synchronization points critical for real-time systems.
- Performance Analysis: These models help identify bottlenecks and latency issues before implementation begins.
- UML Standard: Timing diagrams are a distinct behavioral diagram type within the Unified Modeling Language specification.
In the realm of software architecture and system design, understanding how components interact over time is as critical as understanding what they interact with. While sequence diagrams illustrate the flow of messages, they often lack the precision required for performance-critical systems. Timing diagrams fill this gap by providing a detailed view of state changes and signal transitions relative to time. This article explores the mechanics of timing diagrams, their role in defining constraints, and how they contribute to the reliability of complex software architectures.
📐 Defining the Timing Diagram
A timing diagram is a specialized behavioral diagram in the Unified Modeling Language (UML). It focuses on the behavior of objects over time, showing how the state of an object changes in response to events. Unlike other diagrams that prioritize logical flow, this model prioritizes temporal relationships. It is particularly useful when the timing of events is the determining factor for system correctness.
The horizontal axis represents time, flowing from left to right. The vertical axis represents different objects, lifelines, or states. This layout allows architects to visualize exactly when a signal is sent, received, or processed. It is not merely a chart; it is a specification of temporal constraints that must be met for the system to function as intended.
Consider a real-time control system, such as an automotive braking module. The sequence of events matters, but the duration between pressing the pedal and engaging the brakes is paramount. A timing diagram captures this duration, ensuring the system meets safety standards. Without this level of detail, performance bottlenecks might only become apparent during late-stage testing, leading to costly revisions.
🧩 Core Components and Anatomy
To effectively analyze performance constraints, one must understand the building blocks of these diagrams. Each element serves a specific purpose in defining the temporal behavior of the system.
- Lifelines: Represent the participants in the interaction, such as classes, objects, or hardware components. They span the width of the diagram and anchor the state changes.
- Time Markers: Vertical lines indicating specific points in time. These act as references for measuring delays, durations, and deadlines.
- State Expressions: Indicators of the current state of an object. These change when signals are received or internal conditions are met.
- Signal Transitions: Arrows representing the sending and receiving of signals. The position along the time axis determines when the event occurs.
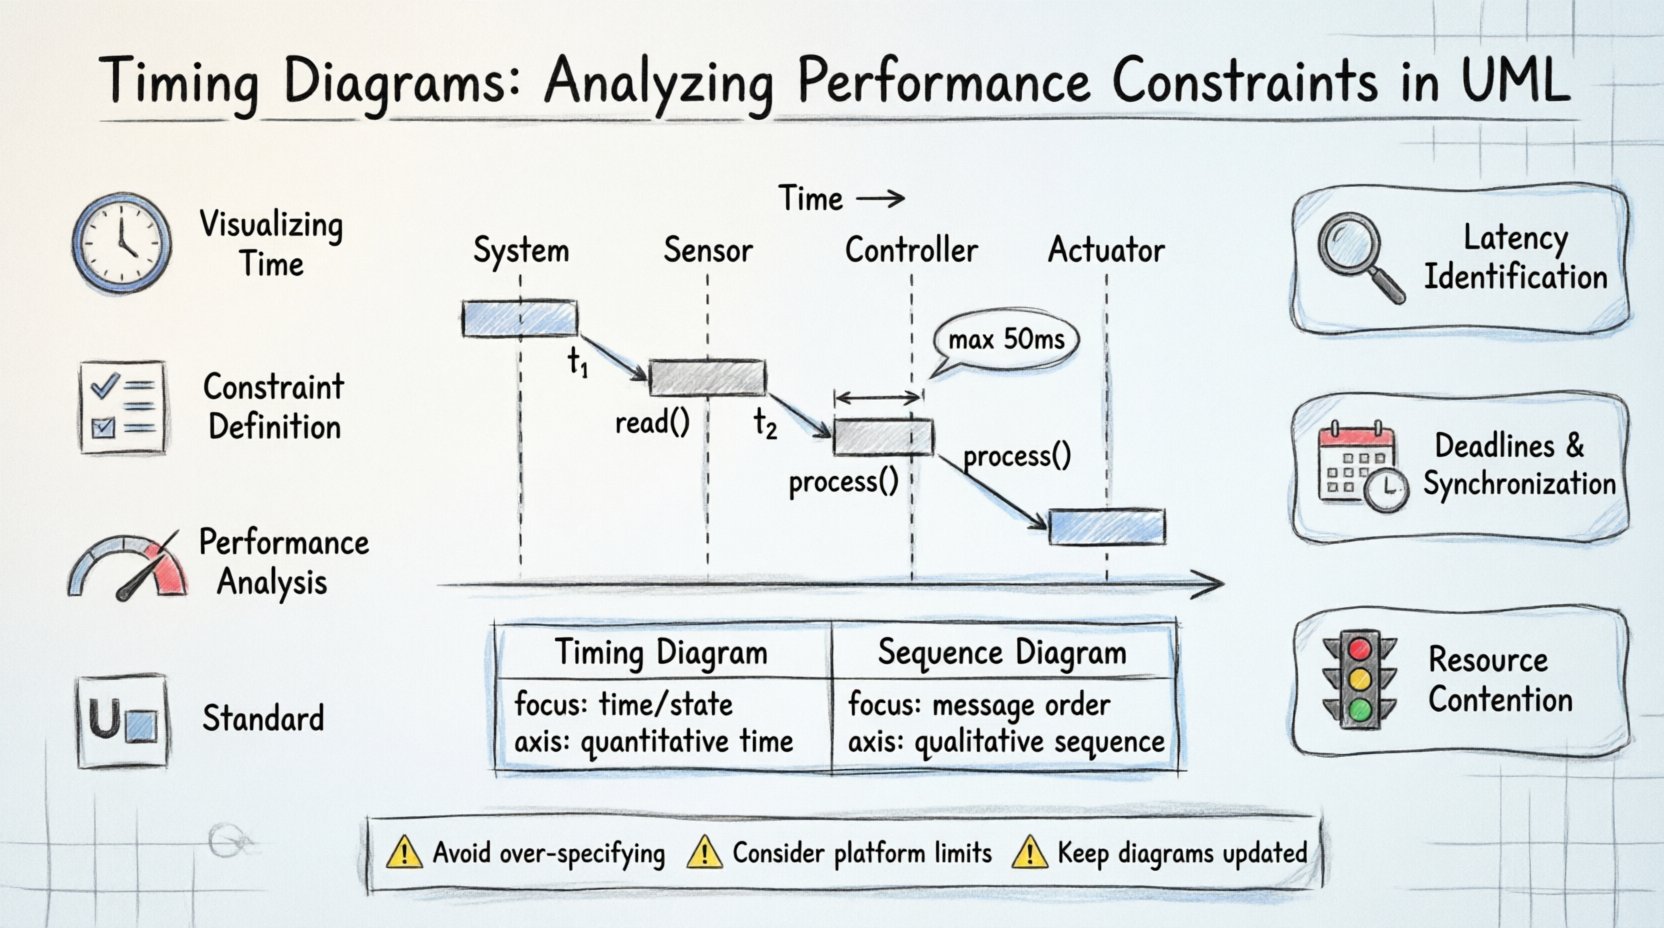
- Constraints: Textual annotations defining limits, such as “max 50ms” or “must occur before t=100”.
When constructing a diagram, precision is key. A state change should not be ambiguous. If an object enters a “Processing” state, the duration of that state must be clear. Is it instantaneous? Does it last for a fixed duration, or is it event-driven? These distinctions define the accuracy of the model.
⚙️ Analyzing Performance Constraints
The primary value of timing diagrams lies in their ability to expose performance constraints early in the design phase. By mapping out the timeline, architects can identify where latency might accumulate or where synchronization failures could occur.
1. Latency Identification
Latency refers to the delay between a request and a response. In a timing diagram, this is visible as the horizontal distance between a signal arrow leaving one lifeline and the corresponding action occurring on another. By summing these distances, you can calculate total end-to-end latency. If the sum exceeds the system’s requirement, the design must be adjusted. This might involve optimizing algorithms, caching data, or restructuring the interaction flow.
2. Deadlines and Synchronization
Critical systems often have hard deadlines. A timing diagram allows you to mark these deadlines explicitly. For example, a safety signal must reach the controller before a specific time marker. If the diagram shows the signal arriving after the marker, the design fails the constraint. Synchronization is also visualized here. If two objects must act simultaneously, their state transitions should align on the same vertical time line. Misalignment indicates a race condition or a need for a synchronization barrier.
3. Resource Contention
While timing diagrams primarily focus on signals, they indirectly reveal resource contention. If a single object is required to process multiple incoming signals simultaneously, the diagram will show overlapping activation bars. This suggests that the object may become a bottleneck. In such cases, parallel processing or queuing mechanisms may need to be introduced to manage the load effectively.
📊 Timing Diagrams vs. Sequence Diagrams
It is common to confuse timing diagrams with sequence diagrams, as both depict interactions between objects. However, their purposes differ significantly. Sequence diagrams focus on the order of messages and the logical flow of control. Timing diagrams focus on the duration of states and the precise timing of events.
| Feature | Timing Diagram | Sequence Diagram |
|---|---|---|
| Focus | Time and state changes | Order of messages |
| Horizontal Axis | Time (quantitative) | Sequence (qualitative) |
| Constraints | Explicit deadlines and durations | Conditional logic |
| Best Use | Real-time systems, performance analysis | General logic flow, user interactions |
Understanding this distinction ensures the right tool is used for the right job. Using a timing diagram for general logic can introduce unnecessary complexity, while using a sequence diagram for real-time constraints may lead to missed deadlines.
🛠 Implementation Considerations
Translating a timing diagram into code requires careful attention to the model. The constraints defined in the diagram must be reflected in the implementation logic. This often involves setting up timers, using real-time operating system (RTOS) features, or implementing strict polling mechanisms.
Documentation is another critical aspect. The diagram serves as a contract between the design team and the implementation team. Any deviation from the specified timing must be documented and justified. If a delay is unavoidable, the constraint must be updated, and the impact on the overall system must be assessed.
Testing also relies heavily on these diagrams. Automated test suites can be generated to verify that the system adheres to the timing constraints. If a test fails because a signal arrived 5ms late, the timing diagram provides the baseline for the expected behavior. This creates a traceability link between the design model and the verification process.
🚧 Common Pitfalls to Avoid
Even experienced architects can fall into traps when creating timing diagrams. One common mistake is over-specifying. Not every interaction requires a precise timeline. Adding time markers to every message can clutter the diagram, making it difficult to read. Focus on the critical paths where timing is a constraint.
Another pitfall is ignoring the underlying platform. A timing diagram might specify a 10ms response time, but if the target hardware cannot process requests that fast, the model is flawed. The diagram should reflect the capabilities of the actual environment where the software will run.
Avoid treating the diagram as static. As the system evolves, timing requirements may change. Regular reviews of the model ensure it remains accurate. If a new feature is added, its impact on the existing timeline must be analyzed to ensure no deadlines are violated.
🔍 Deep Dive: Signal Transitions
Signal transitions are the heartbeat of a timing diagram. They represent the actual flow of data or control. When analyzing these transitions, look for gaps. A gap between a signal being sent and received indicates network latency or processing delay. A gap between receiving and acting indicates internal processing time.
Consider the concept of “activation bars.” These represent the period during which an object is actively performing an operation. The length of this bar corresponds to the duration of the operation. If the bar extends beyond a defined deadline, the operation is non-compliant. This visual cue makes it easy to spot violations without reading complex numerical data.
In complex systems, multiple signals may overlap. This requires careful management. If two signals require the same resource, the diagram must show how they are serialized. This serialization adds latency, which must be accounted for in the total timing budget. Failure to account for this can lead to system hangs or data loss.
🎯 Conclusion
Timing diagrams provide a rigorous method for analyzing performance constraints within UML models. By focusing on time and state changes, they offer insights that sequence diagrams cannot. They are essential for systems where correctness depends on meeting deadlines, such as embedded systems, financial trading platforms, and safety-critical applications.
Adopting this modeling technique early in the development lifecycle allows teams to identify risks before writing code. It fosters a culture of precision and accountability. When every millisecond is accounted for, the resulting system is more reliable, predictable, and robust. This approach transforms abstract requirements into concrete, verifiable specifications.