


💡 Key Takeaways
- Unified Standard: UML provides a common visual language for architects and developers to communicate system design.
- Two Main Types: Focus on Structural diagrams (static) and Behavioral diagrams (dynamic) to cover all aspects.
- Communication Tool: Diagrams reduce ambiguity and align expectations before coding begins.
- Simplicity First: Start with Class and Use Case diagrams to capture core requirements effectively.
In the landscape of software engineering, clear communication is often as critical as the code itself. When teams design complex systems, relying solely on verbal descriptions or text documents can lead to misunderstandings, rework, and architectural inconsistencies. This is where the Unified Modeling Language, commonly known as UML, comes into play. It serves as a standardized visual notation that allows developers, architects, and stakeholders to conceptualize, visualize, and document software systems.
This guide provides a foundational understanding of UML. You do not need to be a specialist to benefit from these concepts. By integrating these diagrams into your workflow, you establish a shared vocabulary that bridges the gap between business requirements and technical implementation.
Understanding the Purpose of UML 📐
UML is not a programming language. You cannot compile it to create an executable application. Instead, it is a modeling language used to specify, construct, document, and visualize the artifacts of a software system. Think of it as a blueprint for a building. An architect draws the plans before construction begins to ensure all rooms connect correctly and the structure remains sound. Similarly, UML diagrams help developers plan the structure and behavior of software.
The primary goal is to reduce ambiguity. When a developer reads a sequence diagram, they can see exactly how objects interact over time. When a stakeholder views a use case diagram, they can verify that the system will meet their needs without reading through pages of text. This visual approach saves time and resources by identifying potential issues early in the design phase.
Core Categories of UML Diagrams 🧩
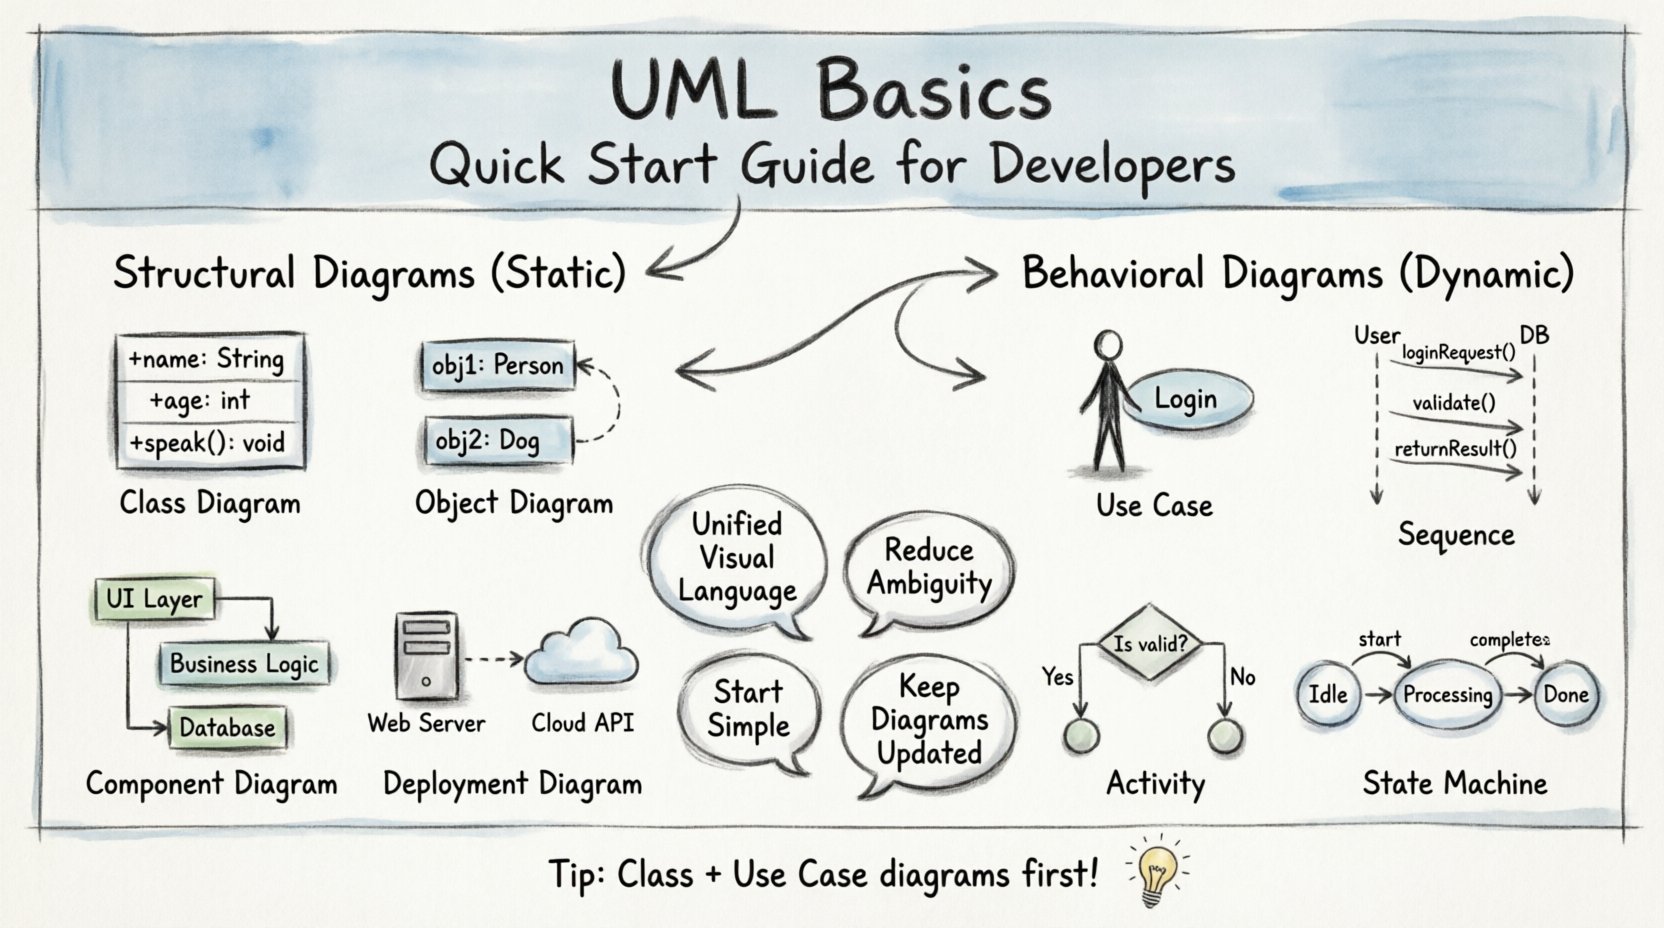
UML diagrams are generally divided into two broad categories: Structural and Behavioral. Structural diagrams describe the static aspects of the system, such as its components and relationships. Behavioral diagrams describe the dynamic aspects, focusing on how the system functions and changes over time.
1. Structural Diagrams 🔨
These diagrams capture the static structure of a system. They are essential for understanding the building blocks of your application.
- Class Diagram: This is the most widely used diagram in object-oriented design. It shows classes, their attributes, operations, and the relationships among objects. It serves as the backbone for your codebase.
- Object Diagram: A snapshot of instances of classes at a specific moment in time. It helps visualize how data flows through the system during runtime.
- Component Diagram: This depicts the high-level organization of the system. It shows how different parts of the software interact with one another, focusing on interfaces and dependencies.
- Deployment Diagram: This illustrates the physical architecture of the system. It maps software components to hardware nodes, showing where processes are executed.
2. Behavioral Diagrams ⚙️
Behavioral diagrams focus on the interactions and activities within the system. They are crucial for understanding the flow of logic.
- Use Case Diagram: This captures the functional requirements of the system. It identifies actors (users or external systems) and the goals they want to achieve. It is excellent for defining the scope of a project.
- Sequence Diagram: This shows how objects interact in a specific scenario. It orders messages chronologically, making it easy to trace the flow of control from one object to another.
- Activity Diagram: Similar to a flowchart, this describes the flow of control from activity to activity. It is useful for modeling business processes or complex algorithms.
- State Machine Diagram: This models the life cycle of an object. It shows the different states an object can be in and the events that cause it to transition from one state to another.
Comparing Diagram Usage 📊
Knowing which diagram to use at the right time is a skill that develops with practice. The following table outlines common scenarios and the recommended diagram type.
| Scenario | Recommended Diagram | Primary Focus |
|---|---|---|
| Defining system scope | Use Case | Functional Requirements |
| Designing database schema | Class | Entities and Relationships |
| Debugging interaction flow | Sequence | Object Communication |
| Modeling business logic | Activity | Process Flow |
| Visualizing hardware layout | Deployment | Physical Infrastructure |
Implementing UML in Your Workflow 🛠️
Integrating modeling into your development process does not require a complete overhaul. Start small and focus on the areas where communication is most challenging.
Start with the Class Diagram
Before writing a single line of code, draft a Class Diagram. Identify the core entities in your domain. Define their attributes and the methods they must expose. This exercise forces you to think about data relationships and constraints early, preventing messy refactoring later.
Use Sequence Diagrams for APIs
When designing an API or a microservice, a Sequence Diagram is invaluable. Map out the request from the client to the server, including database calls and external service interactions. This ensures that error handling and data validation points are visible before implementation begins.
Keep It Simple
It is common for teams to create overly complex diagrams that no one reads. A diagram that is difficult to understand defeats the purpose. Stick to the basics. Use standard notation. Avoid cluttering the page with unnecessary details. The goal is clarity, not artistic perfection.
Common Pitfalls to Avoid ⚠️
Even with the best intentions, teams often struggle with modeling. Here are common mistakes to watch out for.
- Over-Modeling: Creating diagrams for every single method in a small application. Focus on the high-level architecture and critical paths.
- Outdated Diagrams: If the code changes but the diagram does not, the diagram becomes a liability. Treat diagrams as living documents that must evolve with the code.
- Ignoring Notation Standards: Using custom symbols that your team does not recognize. Stick to the standard UML shapes and lines to ensure everyone interprets the diagram the same way.
- Separating Design from Code: Creating diagrams in isolation without considering implementation constraints. Ensure the design is technically feasible.
The Value of Visual Thinking 💭
Visual thinking accelerates cognitive processing. Humans process images significantly faster than text. A well-drawn diagram can convey complex system states in seconds that would take minutes to describe in writing. This efficiency is particularly valuable during code reviews and architecture discussions.
Furthermore, diagrams serve as documentation. When a new developer joins the team, they can look at the Class Diagram to understand the data model. They can look at the Sequence Diagram to understand how the system handles specific requests. This reduces the onboarding time and preserves institutional knowledge even if team members change.
Next Steps for Your Team 📈
Adopting UML is a journey. Begin by introducing the concept to your team during the design phase of your next project. Select one diagram type that addresses your current pain points, such as Use Case for requirements or Class for structure. Practice using it consistently. Over time, you will notice improvements in code quality and team alignment.
Remember that the tool is secondary to the thinking process. The act of drawing the diagram forces you to clarify your thoughts. Whether you use specialized software or pen and paper, the value lies in the modeling itself. By embracing these visual techniques, you build a stronger foundation for your software projects.
As you move forward, keep your diagrams updated and relevant. Let them guide your development, not constrain it. With practice, these visual tools will become an integral part of your engineering toolkit, helping you build robust and maintainable systems.