


Czy jesteś zmęczony patrzeniem na pusty płótno, próbując zrozumieć, dlaczego Twój zespół opuszcza firmę szybciej niż pasażerowie na przeciekającym łodzi? Określanie „dlaczego” za złożonymi problemami biznesowymi może wydawać się jak rybołowienie w ciemności bez przynęty. Na szczęście, Generowanie diagramu rybki za pomocą AI pojawił się, by przekształcić Twoje zniechęcenie podczas sesji mózgowego sztormu w strukturalne sztukę. Wykorzystując moc Visual Paradigm Desktop, możesz teraz przekształcić prosty zdanie o swoich problemach organizacyjnych w profesjonalny, hierarchiczny diagram analizy przyczyn głębokich w mgnieniu oka. Nie ma już potrzeby ręcznego rysowania każdej kości; niech AI zajmie się ciężką pracą, a Ty skup się na rzeczywistych rozwiązaniach!
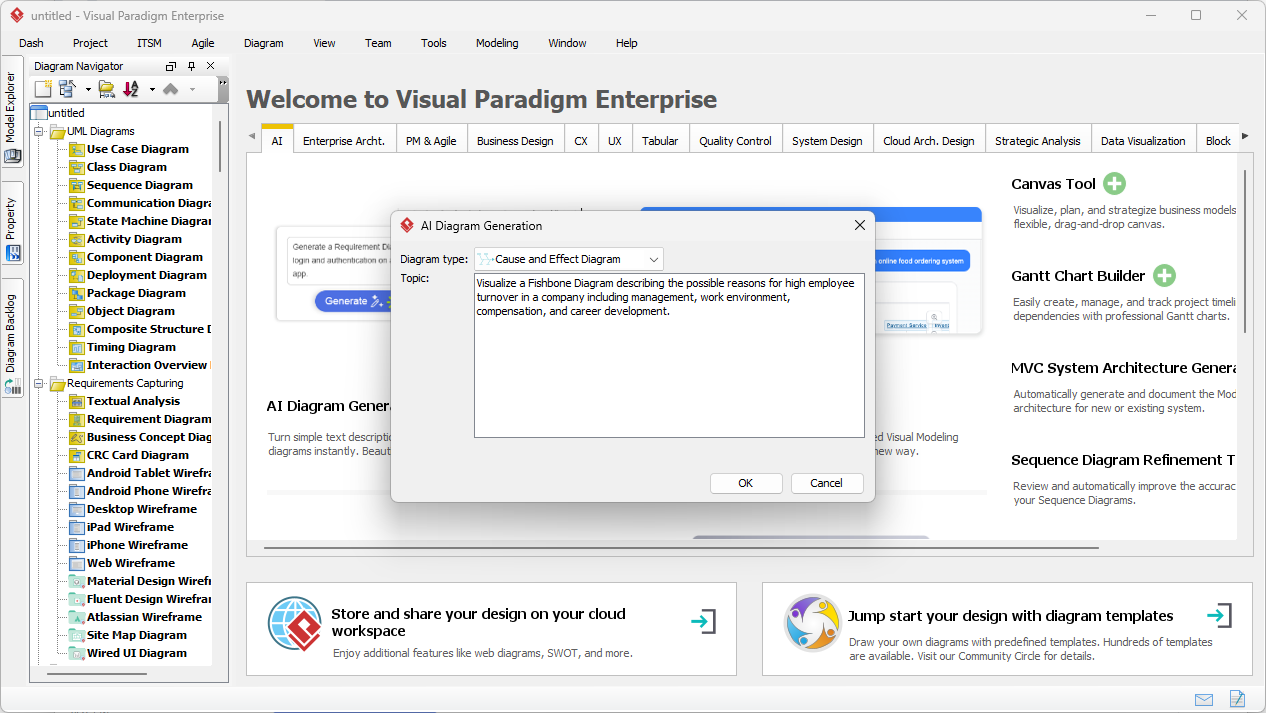
W naszym pierwszym spojrzeniu na interfejs widzimy Generowanie diagramu za pomocą AIokno w działaniu. Użytkownik wybrał „Diagram przyczyn i skutków” z menu rozwijanego — co dla tych, którzy nie znają, to formalna nazwa naszego płetwionego przyjaciela, diagram rybki lub diagram Ishikawy. Wprowadzony prompt jest konkretny i ostrożny: „Zilustruj diagram rybki opisujący możliwe przyczyny wysokiego obrotu pracowników w firmie, uwzględniając zarządzanie, środowisko pracy, wynagrodzenia i rozwój kariery.” Tutaj dzieje się magia; łatwy w użyciu generator diagramów za pomocą AI przyjmuje te wpisy w języku naturalnym i przygotowuje się do stworzenia logicznego układu przyczyn, który zwykle wymagałby godzin ręcznej pracy.
Szybki podsumowanie: dlaczego potrzebujesz narzędzia Fishbone z możliwością AI
-
Natychmiastowa integralność strukturalna: Automatycznie organizuje surowe notatki w klasycznym formacie „głowa i kręgosłup” diagramu rybki.
-
Inteligentna kategoryzacja: Inteligentnie grupuje przyczyny według standardowych kategorii 6M/8P lub tworzy niestandardowe kategorie na podstawie Twojego tekstu.
-
Estetyka na poziomie profesjonalnym: Generuje czyste, zrównoważone układy gotowe do prezentacji w sali zarządu lub raportów o wysokim stopniu znaczenia.
-
Pełna elastyczność: Po tym, jak AI stworzy szkielet, masz pełną moc edycji aby dostosować, kolorować i dopasować każdy gałąź.
-
Paliwo do współpracy: Przekształca nieprecyzyjne skargi w wizualny plan działania, który zespoły mogą naprawdę omawiać i realizować.
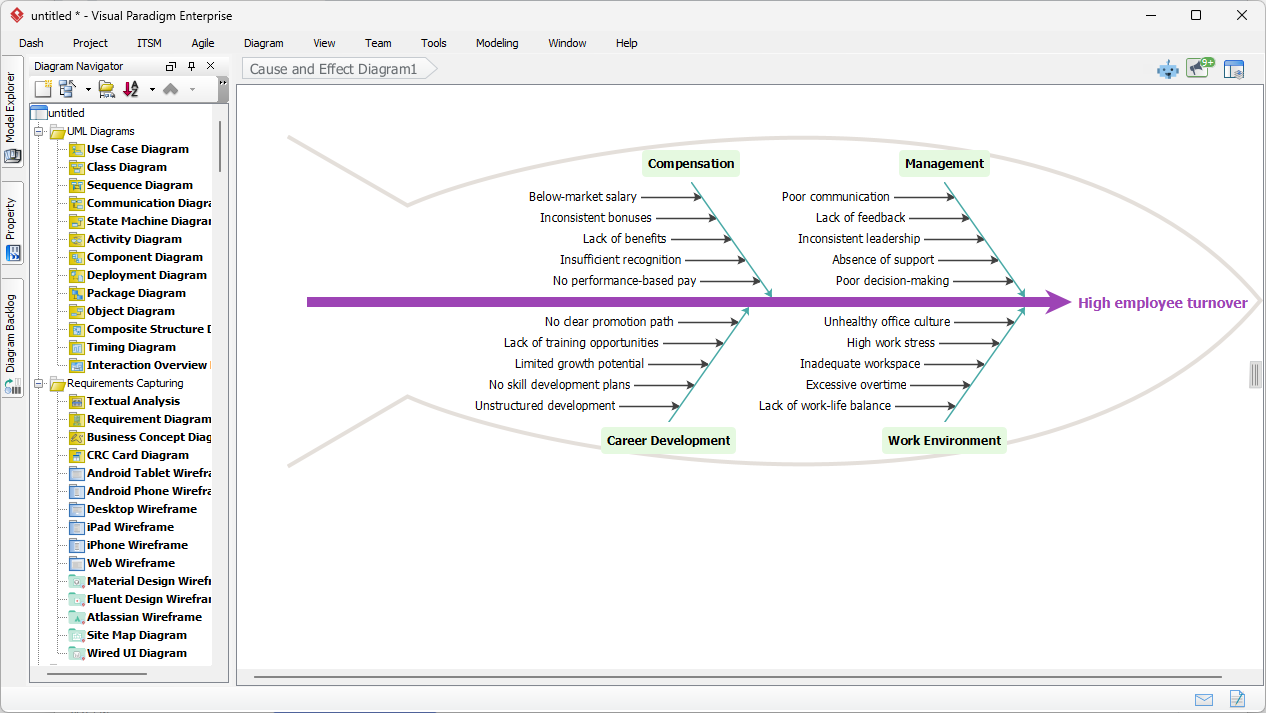
Kiedy klikniesz przycisk „OK”, przemiana jest niewiarygodna. Jak widać na naszym drugim wizualnym przykładzie, najlepsze oprogramowanie do diagramów rybki z AI nie daje tylko ogólnego listy; tworzy szczegółową, wieloaspektowądiagram Ishikawy skupiony na kluczowym problemie: „Wysoka rotacja pracowników”. AI precyzyjnie zinterpretowała prompt, tworząc cztery główne „kostki” – Wynagrodzenie, Zarządzanie, Rozwój Karierowy i Środowisko Pracy. Każda z tych kategorii jest następnie wypełniona szczegółowymi podpowodami. Na przykład pod „Wynagrodzeniem” widzimy konkretne problemy, takie jak „Poniżej rynkowej pensji” i „Niespójne premie”, podczas gdy „Zarządzanie” wyróżnia „Złą komunikację” i „Brak zwrotu informacji.”
Anatomia analizy przyczyn głębokich wygenerowanej przez AI
Wynikiem jestprofesjonalny diagram kościołka który przestrzega ścisłych zasad notacji, jednocześnie wyglądając niesamowicie profesjonalnie. „Głowa” ryby jasno wskazuje niepożądany efekt, podczas gdy „Kręgosłup” łączy główne kategorie przyczyn. Co naprawdę wrażająco jest tohierarchiczne rozgałęzienie; AI identyfikuje czynniki wtórne (podkostki), które wyjaśniają „dlaczego” za „co”. Ten poziom szczegółowości jest kluczowy dla każdego, kto stosujeSix Sigma, Lean lub Kaizen, ponieważ pozwala zespołom przejść poza objawami i głęboko zagłębić się w rzeczywiste przyczyny problemu.
Toinnowacyjna funkcja diagramowania z AI nie jest tylko dla ekspertów z produkcji; to ratunek dla menedżerów projektów, specjalistów HR i analityków biznesowych. Niezależnie od tego, czy masz do czynienia z nagłym wzrostem wad produktu, czy jak pokazano w naszym przykładzie, spadkiem kompetencji w Twoim działzie,narzędzie Visual Paradigm z funkcją AI działa jak Twój cyfrowy konsultant. Zapewnia, że nie przeoczyłeś kluczowych kategorii, takich jak „Matka Przyroda” (Środowisko) lub „Pomiar”, które mogą zostać pominięte podczas chaotycznej sesji mózgowego sztormu. To jak miećeksperta w analizie przyczyn głębokich eksperta w analizie przyczyn głębokich siedzącego wprost w Twoim oprogramowaniu na komputerze!
Poradnik krok po kroku: Jak stworzyć własny sztukowy diagram kościołka
Zaczynanie pracy z tymzaawansowanym oprogramowaniem do tworzenia diagramów jest łatwiejsze niż przygotowanie filiżanki kawy. Postępuj zgodnie z tymi prostymi krokami, aby przejść od stwierdzenia problemu do wizualnego rozwiązania:
-
Uruchom Visual Paradigm Desktop: Otwórz swój projekt i przejdź doNarzędzia menu na górnym pasku narzędzi.
-
Wyzwij AI: KliknijGenerowanie diagramu z AI aby wyświetlić okno promptu.
-
Wybierz swój smak: W polu „Typ diagramu” wybierz Diagram przyczyn i skutków. Nie martw się — to tylko wyrafinowana akademicka nazwa dla diagramu kościoła!
-
Opisz zamieszanie: W polu „Temat” wpisz swój problem oraz wszystkie podejrzane przyczyny, które już zidentyfikowałeś. Możesz być jak najbardziej szczegółowy lub skromny, jak chcesz.
-
Niech gotuje się: Naciśnij „OK” i obserwuj, jak generator Ishikawy napędzany AI wypełnia ekran idealnie sformatowanym diagramem.
-
Doskonal i wygładzaj: Użyj zintegrowanego edytora diagramów aby dodać oznaczenia priorytetów, zmienić kolory gałęzi w celu wyróżnienia kluczowych ścieżek lub dołączyć notatki dowodowe bezpośrednio do kości.
Kto najbardziej korzysta z tej magii AI?
Chociaż każdy lubi dobry skrót, to profesjonalny narzędzie do analizy przyczyn głębokich to zmieniający grę narzędzie dla określonych ról.Specjaliści ds. jakości mogą go wykorzystać do dokumentowania błędów produkcyjnych z precyzją kliniczną.Menadżerowie projektów mogą wizualizować „dlaczego” nie udało się dotrzymać terminów, nie poświęcając godzin w PowerPointzie. Nawet studentów i nauczycieli z inżynierii przemysłowej lub zarządzania biznesowym mogą wykorzystać to do szybkiego zrozumienia relacji między zmiennymi w złożonych systemach. Łączy luki między surowymi danymi a praktycznymi wskazówkami, czyniąc złożone rozwiązywanie problemówdostępne dla każdego, niezależnie od ich umiejętności artystycznych.
Podsumowując, Generowanie diagramu kościoła z wykorzystaniem AI funkcja w Visual Paradigm jest więcej niż tylko nowością — to potężny narzędzie produktywności. Automatyzując kłopotliwe zadanie układania i kategoryzacji, pozwala Ci poświęcić swoją energię umysłową tam, gdzie najbardziej się liczy: naprawie rzeczywistego problemu. Niezależnie od tego, czy rozwiązuje się wysokie obroty pracowników, czy problem z nieprawidłowym wdrożeniem oprogramowania, to narzędzie gwarantuje, że Twoja analiza będzie kompleksowa, profesjonalna i wizualnie przekonująca. Nie ma już żadnych wyjść dla nieporządnego tablicy lub nieuporządkowanych list; czas zacząć łowić przyczynę i wyłowić rozwiązanie!
Gotowy, by rzucić przynętę w przyszłość diagramowania? Przestań się męczyć z ręcznymi kształtami i pozwól sztucznej inteligencji wykonać ciężką robotę podczas analizy przyczyn głębokich w Twojej kolejnej analizie przyczyn.Pobierz Visual Paradigm dzisiaj i doświadcz najpotężniejszegopotężnej generacji diagramów kiełkowych opartej na sztucznej inteligencji narzędzia na rynku. Przekształć swoje organizacyjne problemy w wizualne sukcesy za pomocą kilku kliknięć!
Odwiedź oficjalną stronę pobierania, aby rozpocząć:https://www.visual-paradigm.com/download/
Linki powiązane
Diagramy kiełkowe, znane również jakodiagramy Ishikawy, to potężne narzędzia doanalizy przyczyn głębokich które wizualnie organizują potencjalne czynniki przyczyniające się do konkretnego problemu lub wadliwego produktu, często ulepszane przezautomatyzację opartą na sztucznej inteligencji oraz specjalistyczneszablony branżowe.
-
Jak stworzyć diagram kiełkowy: Przewodnik krok po kroku: Kompletny przewodnik dotyczący używania tych diagramów do identyfikacji przyczyn głębokich w procesach, projektach lub systemach.
-
Bezpłatne narzędzie do tworzenia diagramów kiełkowych – twórz diagramy natychmiast: Platforma internetowa do tworzenia profesjonalnych diagramów kiełkowych bez konieczności rejestracji lub instalacji oprogramowania.
-
Szablon diagramu kiełkowego (Ishikawy) – gotowy do użycia: Dostosowalny punkt wyjściowy do szybkiego wizualizowania i analizowania przyczyn głębokich w różnych sektorach biznesowych.
-
Generator diagramów kiełkowych z wykorzystaniem sztucznej inteligencji – odkryj przyczyny głębokie w sekundach: Ten artykuł omawia, jak sztuczna inteligencja może zautomatyzować proces tworzenia diagramów, aby przyspieszyć analizę przyczyn głębokich.
-
Diagram kiełkowy i 5 dlaczego – Visual Paradigm: Przewodnik dotyczący integracji diagramów kiełkowych z techniką 5 dlaczego w celu głębszej analizy problemów związanych z kontrolą jakości i zarządzaniem projektami.
-
Rozwiązanie skomplikowanych problemów: Siła analizy przyczyn i skutków: Ten zasób wyjaśnia, jak zorganizowane diagramy Ishikawy wspomagają rozwiązywanie problemów i poprawę procesów w działalności firmowej.
-
Szablon diagramu kiełkowego do problemów z zarządzaniem zapasami: Specjalny szablon używany do identyfikowania przyczyn głębokich opóźnień w łańcuchu dostaw, nadmiaru towarów i rozbieżności w zapasach.
-
Szablon diagramu rybiego karku do analizy wad produktu: Celowy narzędzie dla zespołów produkcyjnych i zapewnienia jakości do analizy wad i poprawy integralności produktu.
-
Narzędzie do diagramu przyczyn i skutków – funkcje Visual Paradigm: Przegląd funkcjonalności oprogramowania zaprojektowanych do wizualizacji i analizy przyczyn głębokich w kontekstach projektów zawodowych.
-
Analiza diagramu rybiego karku: koncepcje, przykłady i rola sztucznej inteligencji: Głęboka analiza podstawowych koncepcji diagramów Ishikawy i zalet stosowania narzędzi modelowania z wykorzystaniem sztucznej inteligencji.